Background
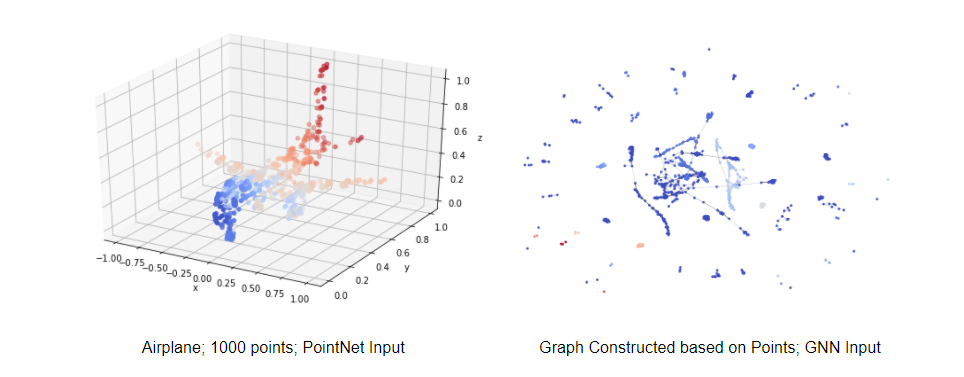
3D points cloud data is widely used in the industry to represent shapes in the real world. Compared with the 3D grids, the format of points like (x, y, z) is more intuitive and compatible with mathematics. Not to mention that 3D points data is much easier to store and read. Deep learning tasks on 3d points data mainly focus on object classification and segmentation. One popular model that is used currently to solve these tasks is the PointNet, which trained a permutation invariant model on a set of points. However, a set of points could also be seen as a graph. In this project, we will explore the use of Graph Neural Network (GNN) on 3d Points cloud classification and compare its performance with the PointNet.
DataSet: ModelNet40 and ShapeNet
In this project, we will mainly train our model on the ModelNet40 dataset. Collected by Princeton, ModelNet40 contains 40 categories of 3d shapes such as airplanes, cars, guitars, etc. Each sample may have 1k - 60k points and also the surface information. Since surface data is not needed in this project, we had a simple preprocessing procedure that extracted points from all samples and stored them in h5py files. The points data will be directly used as the input for our PointNet model.
Points data will also be used to construct graphs. Each data sample (shapes) will be used to construct one corresponding graph using either k-nearest-neighbor or fix-radius. Wanna download two datasets? See details in this link Download
How do we construct the graph?
Like we mentioned, we used k-nearest-neighbor and fix-radius to consturct our graph from points.
-
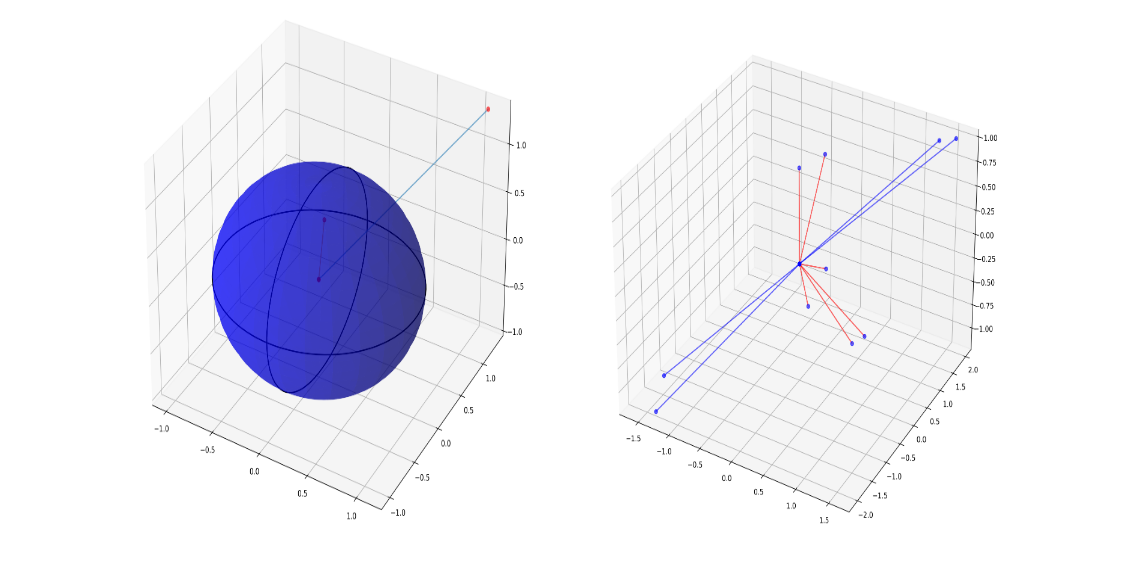
Fix-radius:
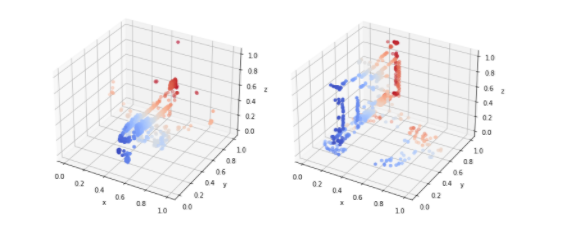
For each data point, we consider all other nodes that are inside a sphere with a fixed radius as this node’s neighbors. In the left below image, the length of the red line is smaller than the r so we will consider this an edge in the graph, while the blue line is longer than the radius so we won’t include this connection. This is a widely used method to construct graphs on a set of points. The advantage is that we can have different popularity for different nodes. For example, if a node is located right in the center of the shape, it will have lots of connections and in the graph, it will be represented as a popular node. However, if a node is in the corner, it will have less points near it and is the graph, it will have less neighbors. The disadvantage is that it takes 2-3x time to construct the graph
-
K-nearest-neighbor:
For each data point, we calculate the first k nearest point and include them as neighbors. In the right below image, we set k = 6. We can see that 6 points that are connected with red lines are 6 nearest points so will consider them as the target node’s connections. While left nodes are too far to be included. The advantage is that the construction process will be much quicker since we can use KDTree and BallTree to accelerate. The disadvantage is that for each data point we will have a fixed number of neighbors.
Mothods: models with permutation invariancy
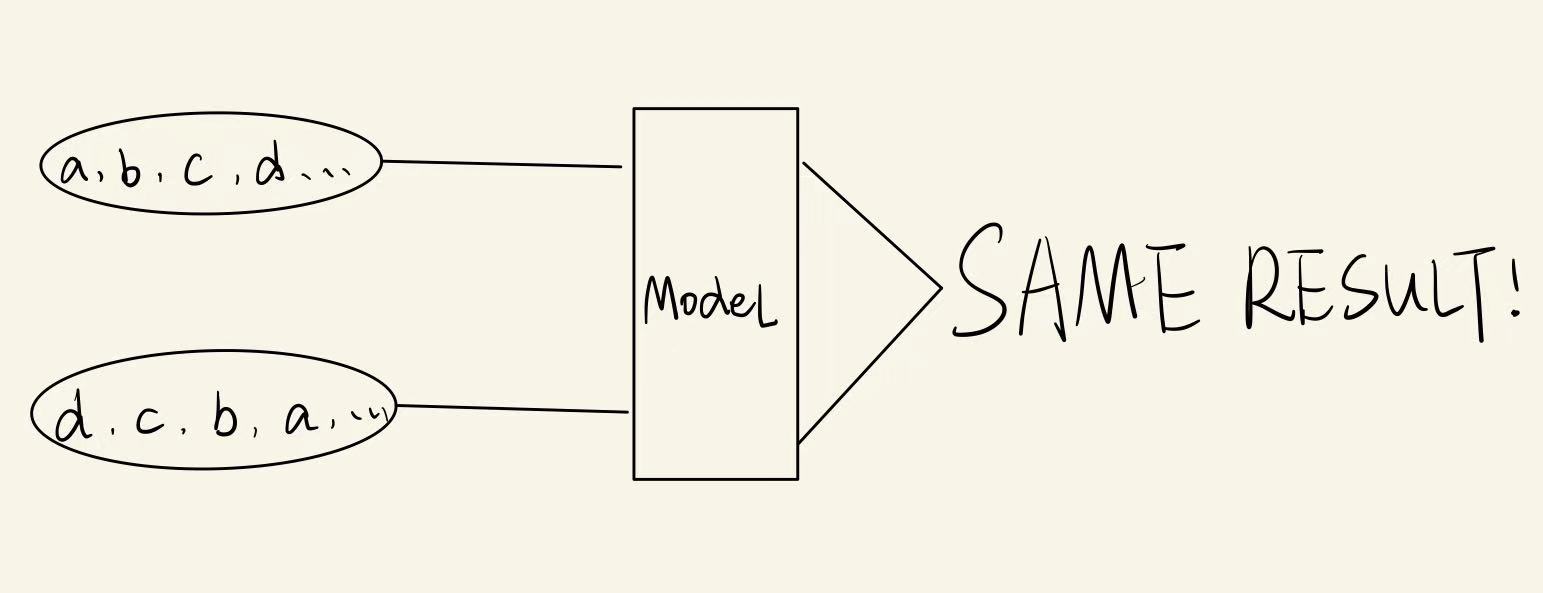
Our model’s input is points cloud, which is essentially a set. We all know that a set does not have orders, which means that no matter in what order we passed in our data into our model, as long as the points are the same, our model should have the exact same result. This is what we called the permutation invariance.
-
PointNet
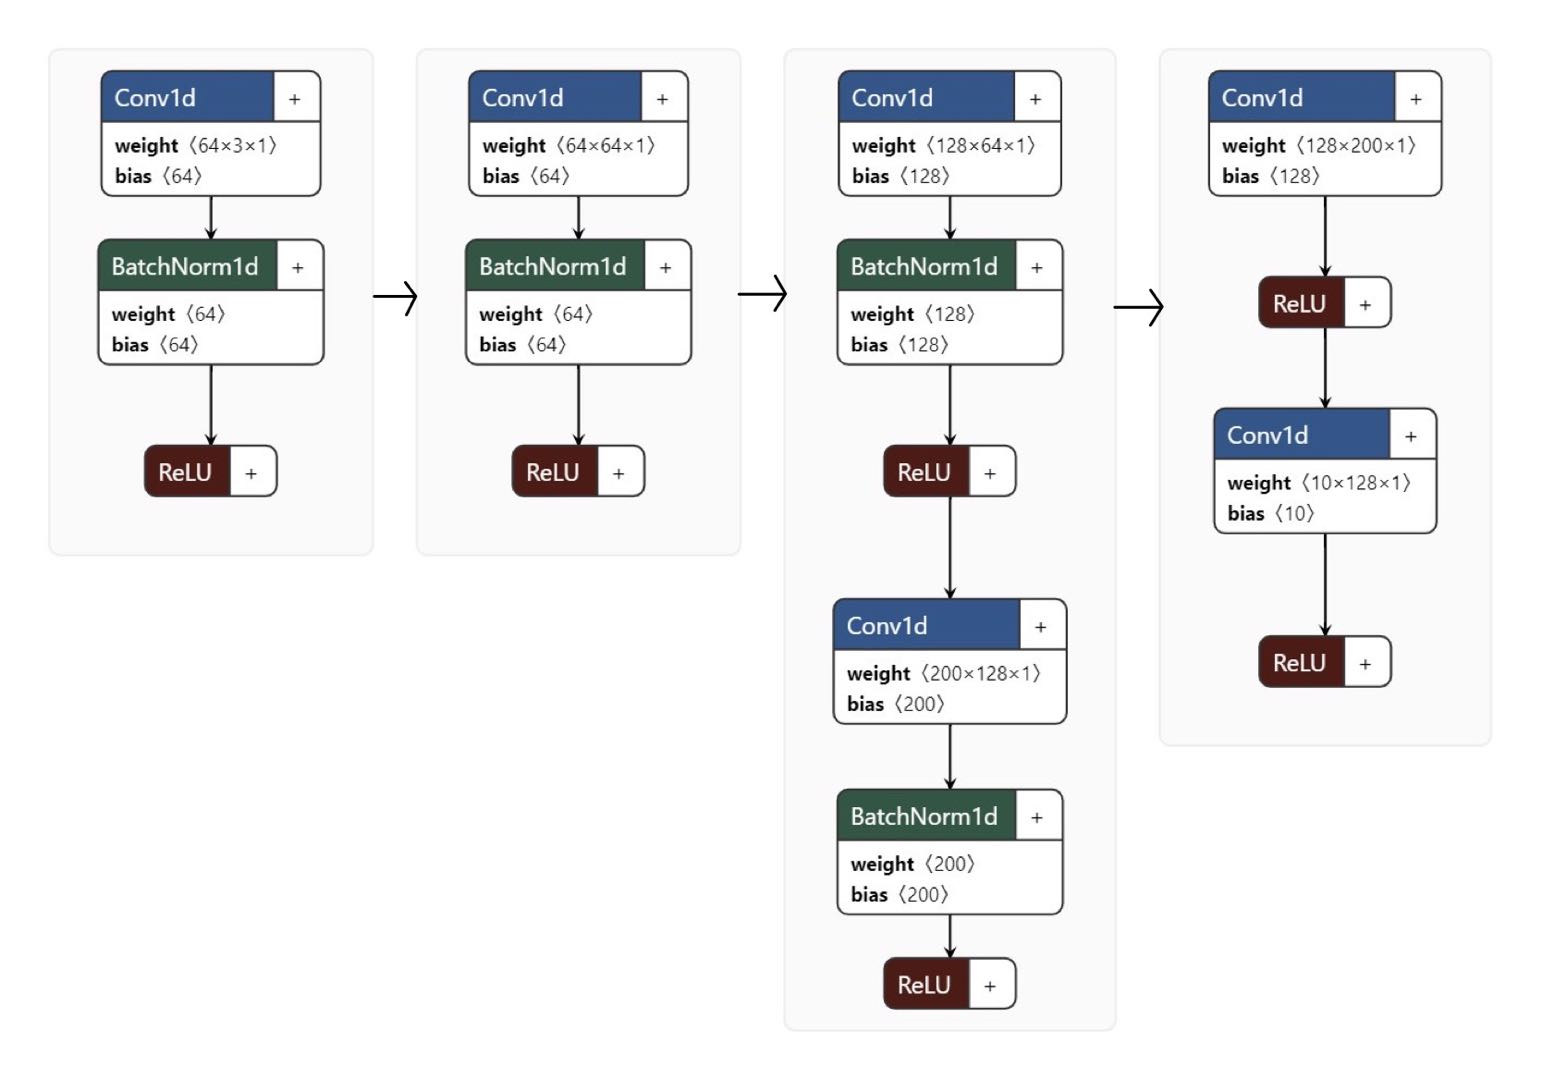
PointNet is an well known model for machine learning tasks on 3d points cloud data, and it will be used as an baseline model in our project. A significant part of the PointNet is the MLP (Multilayer Perceptron) layer, which learn the exact same weights and bias for all points. Since all points share the same weights and bias, the MLP layer is obviously invariant to permutations. Through connecting MLP with non-linear layers and pooling layers (obviously these two are permutation invariant), PointNet has a permutation invariant architecture. In this project, since we are using PointNet as a baseline model, we designed a simple and basic one. The overall structure is similar to the structure of our GCN model.
-
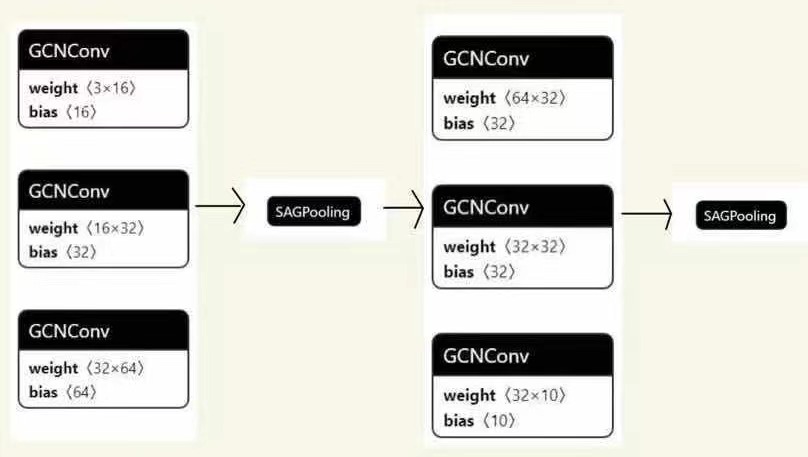
Graph Neural Network
We used Graph convolutional layers to aggregate and extract features. Each convolutional layer is followed by a non-linear layer and a normalization layer. Between each block, we connected graph pooling layers to down-sample the size. The graph convolutional layer is obviously permutation-invariant since the computation is all based on graph, which is indeed a unordered data structure. What’s more, compared with PointNet’s MLP, grapah convolutional layer could aggregate node’s features with its neighbors’ features to better extract local features.
Our Result:
-
Accuracy
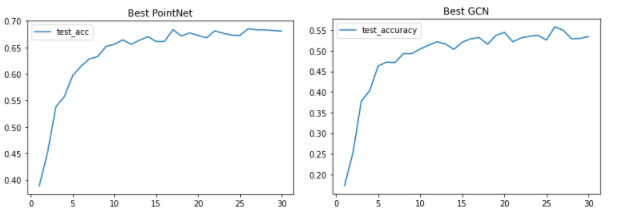
In general, PointNet has a higher max-accuracy on ModelNet40 dataset. After brute force search the hyper-parameters. The best accuracy we found using GCN on 10 categories classification is 57%±2.7%. The deviation is caused by the sampling difference happening in the graph construction process and as well as the model’s initiation values. The best accuracy we found for PointNet is 68%.
-
Confusion Matrix
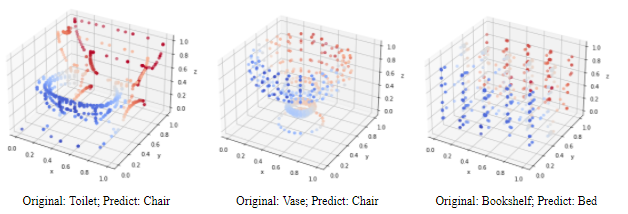
Besides accuracy, a major way to evaluate a classfication model is confusion matrix. Here are two plots for the confusion matrix of GCN and PointNet.
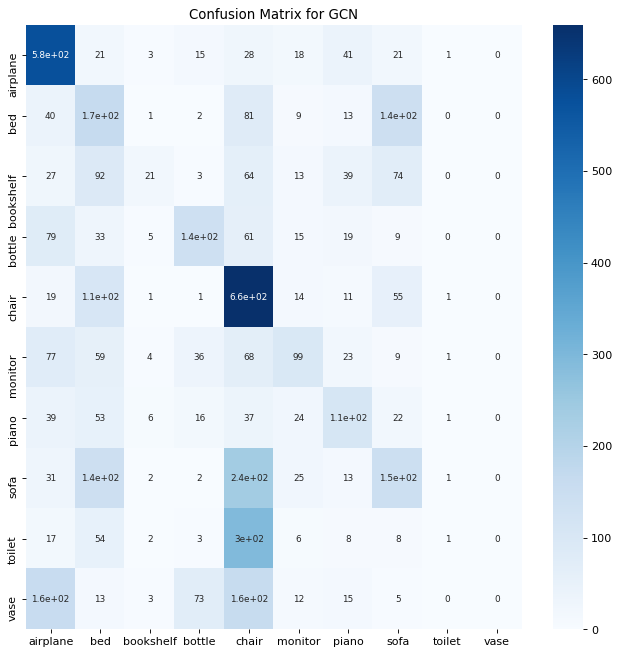
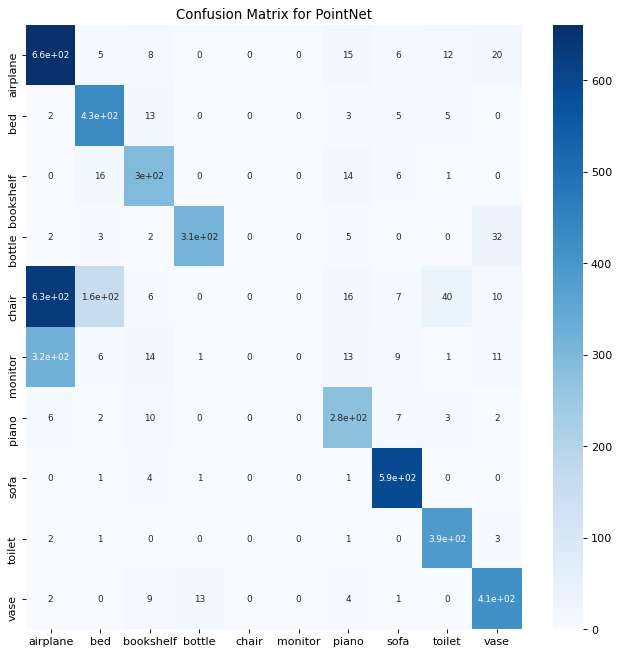
From the matrix, we could see that:
-
GCN tends to misclassify ‘toilet’ and ‘vase’ as ‘chair’, and misclassify ‘bookshelf’ as ‘bed’
-
PointNet tends to misclassify ‘monitor’ as ‘airplane’
However, if we take a look at those misclassified categories. We could see that the misclassified categories of GCN are much more reasonable than PointNet’s. There are a lot of similarities between toilet, vase, and chair, as well as bookshelf and bed. However, monitors and airplanes do not share much similarities. The reason why PointNet tends to misclassify monitors as airplanes is that airplanes contain second most training samples while monitors contain third least training samples. The PointNet model is trained to be greedy with probability. This could be seen as an advantage of GCN. If trained on a balance and large dataset, we expect the GCN model to outperform the PointNet.
-
-
Resistence to data transformation
Our models are trained to predict the shapes. Despite the permutation-invariance we talked before, a good model should also be invariant to different data transformations such as enlarge, shrink, and translation. In our project, we tried three different data augmentations and used them to test GCN and PointNet’s resistance. The results is shown in the below table:
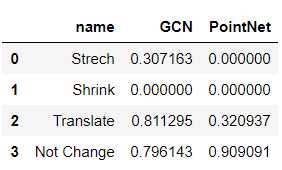
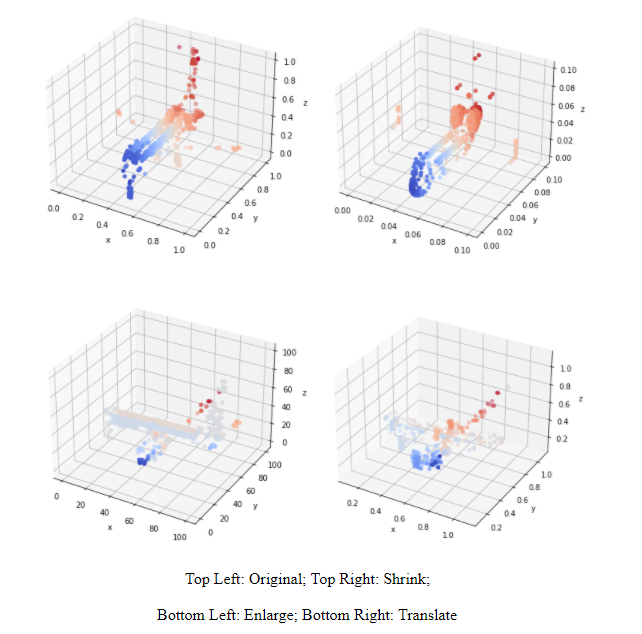
We could see that PointNet has a much worse resistance than GCN. If the data is stretched or shrunk, the pointnet will no longer recognize it anymore. On the other hand, GCN model even did really badly on shrunk data, it did really well on translated data. The stretch procedure is done by multiplying the original data with 100, the shrink procedure is done by multiplying 1e-2, and the translate procedure is done though adding 0.1 to all points within a sample. Three transformations could be seen through the following graph.
-
Pooling Layer
One of the major components in the GCN model is the graph pooling layer. It helps us to reduce the data dimension. Thus we decide to also train a Graph-Pooling-PointNet model. However, this model has the worst result. The best accuracy is about 24% on 10-categories dataset. The reason why graph pooling layers work in GCN but not in pointNet is that the GCN model used graph convolutional layers ahead of graph pooling layers. The graph convolutional layer will aggregate the information within a neighborhood/cluster. Thus when the SAG pooling layer pools out nodes that are considered as less significant nodes in the cluster, their information will maintain in their neighbors. In other words, connecting graph convolutional layers with graph pooling layers will not lose much information while at the same time, reduce the sample size. However, MLPs in pointnet do not aggregate information within a cluster. Thus, if we connect MLPs with graph pooling layers, we actually lose every nodes’ information we pool out. This also explains why the SAGpooling layer has a better result than the ASApooling layer in our project. The reason is that the graph convolutional layer and the SAGpooling layer make up for each other and have really good results.
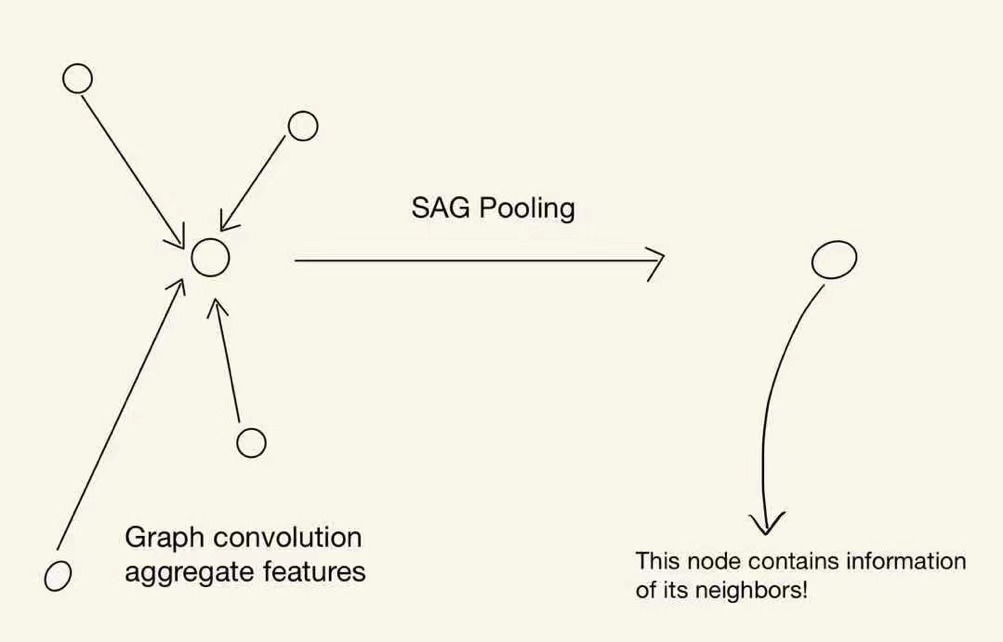
The pooling effects on GCN looks great! Check the GIFs.
Helpful Links:
-
Project code: https://github.com/ctwayen/GNN-Points-Cloud
-
Project docker: https://hub.docker.com/repository/docker/ctwayen/project_docker
-
Contact: ctwayen@outlook.com